We use cookies to enhance your browsing experience, serve personalized ads or content, and analyze our traffic. By clicking "Accept All", you consent to our use of cookies.
Customize Consent Preferences
We use cookies to help you navigate efficiently and perform certain functions. You will find detailed information about all cookies under each consent category below.
The cookies that are categorized as "Necessary" are stored on your browser as they are essential for enabling the basic functionalities of the site. ...
Always Active
Necessary cookies are required to enable the basic features of this site, such as providing secure log-in or adjusting your consent preferences. These cookies do not store any personally identifiable data.
No cookies to display.
Functional cookies help perform certain functionalities like sharing the content of the website on social media platforms, collecting feedback, and other third-party features.
No cookies to display.
Analytical cookies are used to understand how visitors interact with the website. These cookies help provide information on metrics such as the number of visitors, bounce rate, traffic source, etc.
No cookies to display.
Performance cookies are used to understand and analyze the key performance indexes of the website which helps in delivering a better user experience for the visitors.
No cookies to display.
Advertisement cookies are used to provide visitors with customized advertisements based on the pages you visited previously and to analyze the effectiveness of the ad campaigns.
No cookies to display.
Other cookies are those that are being identified and have not been classified into any category as yet.
Climate change will dramatically impact streamflow and its contributions to the Colorado River by increasing forest water use and reducing groundwater levels, new study finds.
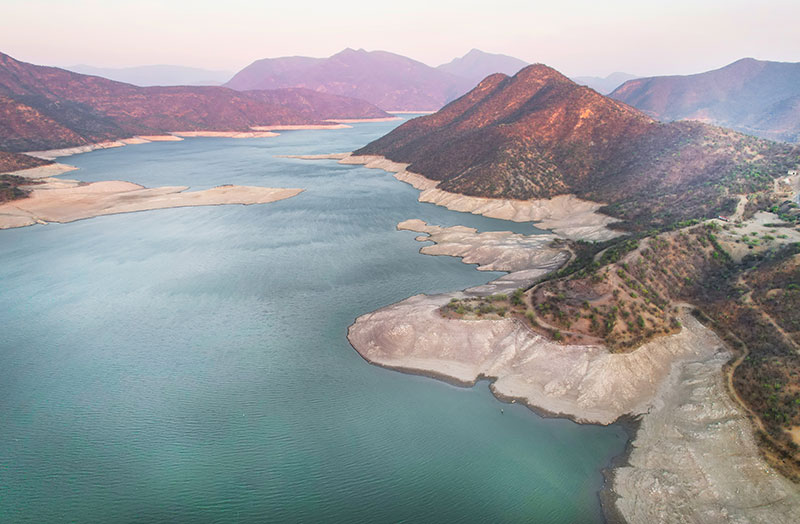
Reno, Nev. (May 20, 2024) – The Colorado River makes life possible in many Western cities and supports agriculture that sustains people throughout the country. Most of the river’s water begins as snowmelt from the mountainous watersheds of Colorado, Utah, and Wyoming, and a warming climate will drastically reduce these streamflows, new research finds.
Researchers from Desert Research Institute (DRI), USGS, and Lawrence Berkeley National Laboratory teamed up for the new study, published May 23 in Nature Water. By applying warming to historical conditions for the East River in Colorado and using computer simulations to observe the impact on streamflow and groundwater levels, the scientists found that groundwater storage would fall to the lowest known levels after the first extremely dry year and fail to recover even after multiple wet periods. When groundwater levels fall, streamflows are drawn into the water table instead of contributing to Colorado River flows.
“We found that groundwater matters a lot,” says Rosemary Carroll, Ph.D., DRI research professor of hydrology and lead author of the study. “Even with historically observed wet periods in the model, the groundwater can’t come back from a single dry water year under end-of-century warming.”
The Colorado River has been in a drought state for decades, creating tensions around water rights throughout the Southwest. Scientists have been perplexed by falling river levels even in relatively wet years – in 2021, the Upper Colorado River Basin reached 80% normal snowpack but delivered only 30% of average streamflow to the river. The study authors wanted to examine how warming in mountain basins may be contributing to this phenomenon. Increased temperatures alter the balance between snowfall and water availability in a number of ways, including more snow evaporation (known as sublimation), more precipitation falling as rain instead of snow, and more frequent melting throughout the winter.
Past research has largely overlooked the role of groundwater and how it may buffer, or intensify, streamflow loss from climate change.
“I’m very interested in the relationship of groundwater contributions to streamflow – that has been a running theme in my research for a long time,” Carroll says. “A lot of studies indicate that in the short term, groundwater release to streamflow will help buffer drought impacts, but before this study, we didn’t have any knowledge on what that would mean over the long haul.”
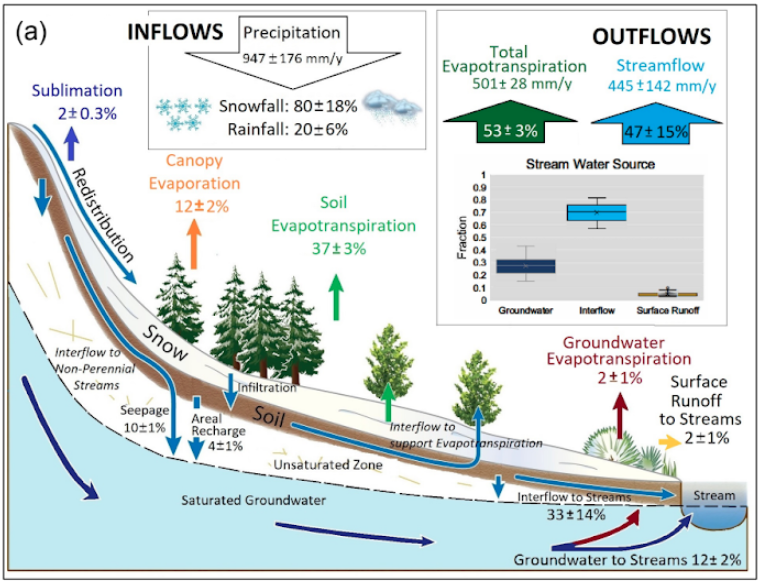
The illustration above shows historical atmospheric and environmental water loss and contributions. From Figure 2 of Caroll et al.
The study authors used the East River as the focus for the research because it is representative of the headwaters of the Colorado River, as well as the significant weather and water monitoring infrastructure available. Ground observations and airborne mapping measure snowpack depth and density, streamflow, plant cover, and groundwater levels, among many other measurements throughout the watershed.
Historical data from 1987 to 2022 was used to create the computer model. The research team then applied 4 degrees Celsius of warming to this time period in two ways: for one simulation, warming was applied constantly across time, while in subsequent simulations, warming was applied to each season independently. The approach allowed the scientists to examine the differing impacts of warming between seasons. Four degrees Celsius is representative of the projected climate at the end of the century based on observed warming of approximately 0.4 degrees Celsius per decade in the watershed. The simulation doesn’t account for likely changes in vegetation over the same timeframe.
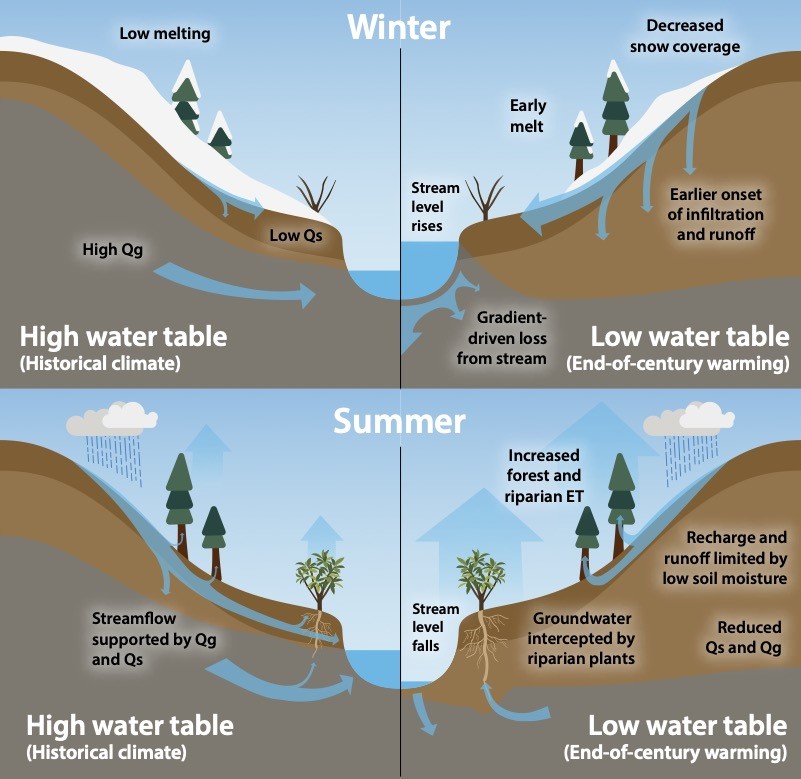
The study showed that consistently warmer temperatures resulted in sharp declines in groundwater levels that were unable to recover to historical average levels during wet periods. Isolating the warming seasonally demonstrated the strong impact of warmer summers on water table declines, as the atmosphere increases evaporation rates, plants increase their water uptake, and soils dry out. The largest declines in water table elevations occur in the subalpine forests where conifer forests are most dense.
“As the groundwater level drops, you lose more streamflow to the water table,” Carroll says. “When precipitation is low, the East River stops flowing for a portion of the summer. Of course, this would have dramatic effects on ecological health and agricultural irrigation.”
By including declining water table levels in the analysis, the study found that streamflow reductions nearly double when compared to simulations that examined the impacts of climate change in the region without accounting for groundwater declines. This is because of the multiple impacts occurring simultaneously: less water flows to streams from the aquifers, while more stream water drains into the soil.
The graphic above illustrates how declining water tables under climate change would decrease streamflows. By Jeremey Snyder, from Figure 8 of Carroll et al.
The research demonstrates the need to jointly manage forest and groundwater in the Upper Colorado River Basin, as well as account for the exchange of surface and groundwater in mountains basins, to minimize streamflow declines under climate change, Carroll says.
“I think of groundwater as your savings account,” she adds. “Snowpack is like your checking account; it changes from year to year. Groundwater is a longer-term investment — it can smooth out the really wet and dry years. But if you start consistently reducing that groundwater year after year, then you can no longer modulate those extremes.”
###
More information: The full study, Declining Groundwater Storage Expected to Amplify Mountain Streamflow Reductions in a Warmer World, is available from Nature Water at https://www.nature.com/articles/s44221-024-00239-0
Funding for the study came from the U.S. Department of Energy Office of Science and Office of Biological and Environmental Research.
Study authors include: Rosemary Carroll (DRI), Richard Niswonger (USGS), Craig Ulrich (Lawrence Berkeley National Laboratory), Charuleka Varadharajan (Lawrence Berkeley National Laboratory), Erica Siirila-Woodburn (Lawrence Berkeley National Laboratory), and Kenneth Williams (Rocky Mountain Biological Laboratory)
About DRI
We are Nevada’s non-profit research institute, founded in 1959 to empower experts to focus on science that matters. We work with communities across the state — and the world — to address their most pressing scientific questions. We’re proud that our scientists continuously produce solutions that better human and environmental health.
Scientists at DRI are encouraged to follow their research interests across the traditional boundaries of scientific fields, collaborating across DRI and with scientists worldwide. All faculty support their own research through grants, bringing in nearly $5 to the Nevada economy for every $1 of state funds received. With more than 600 scientists, engineers, students, and staff across our Reno and Las Vegas campuses, we conducted more than $47 million in sponsored research focused on improving peoples’ lives in 2023 alone.
At DRI, science isn’t merely academic — it’s the key to future-proofing our communities and building a better world. For more information, please visit www.dri.edu.
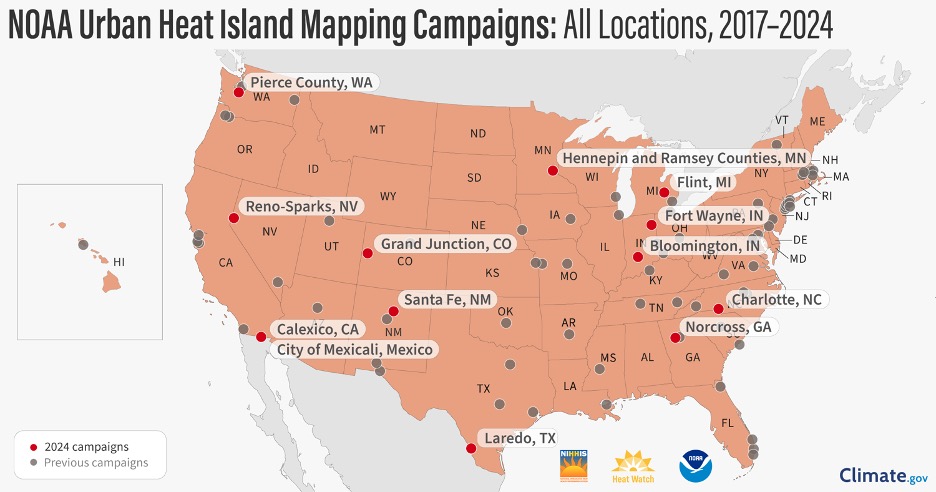
The summer 2024 data collection effort provides community members, legislators, and scientists with detailed maps of the region’s urban heat island.
Reno, Nev. (January 13, 2025) – The Reno-Sparks Heat mapping project team is thrilled to announce the successful completion of our community’s temperature mapping campaign and the release of the campaign’s data and modeled temperature maps! This effort, covering nearly 200 square miles of our Truckee Meadows communities, was led by the Nevada State Climate Office at the University of Nevada, Reno (UNR) with support from climate scientists at the Desert Research Institute (DRI). The mapping effort was conducted by more than 100 volunteers from the local community who came together from over a dozen local and Tribal governmental organizations and community groups.
“The primary goal for this project is understanding the variability in space and time of dangerously high temperatures,” says project leader Tom Albright, Deputy State Climatologist and Associate Professor of geography at the University of Nevada, Reno. “It’s really important we understand and mitigate extreme heat because in addition to urban heat islands, Nevada is one of the fastest warming states under climate change,” he added. The ‘urban heat island’ is the term used to describe the tendency of some urbanized areas to be hotter due to greater amounts of concrete and fewer trees and other vegetation. Heat is our state’s and our nation’s most deadly weather-related hazard, with at least 491 deaths attributed to heat in Nevada in 2024. 2024 was the hottest year on record, following the previous record set in 2023. The last ten years are likely the hottest in the last 125,000 years, scientists say.
A summary report and interactive map can be found here:
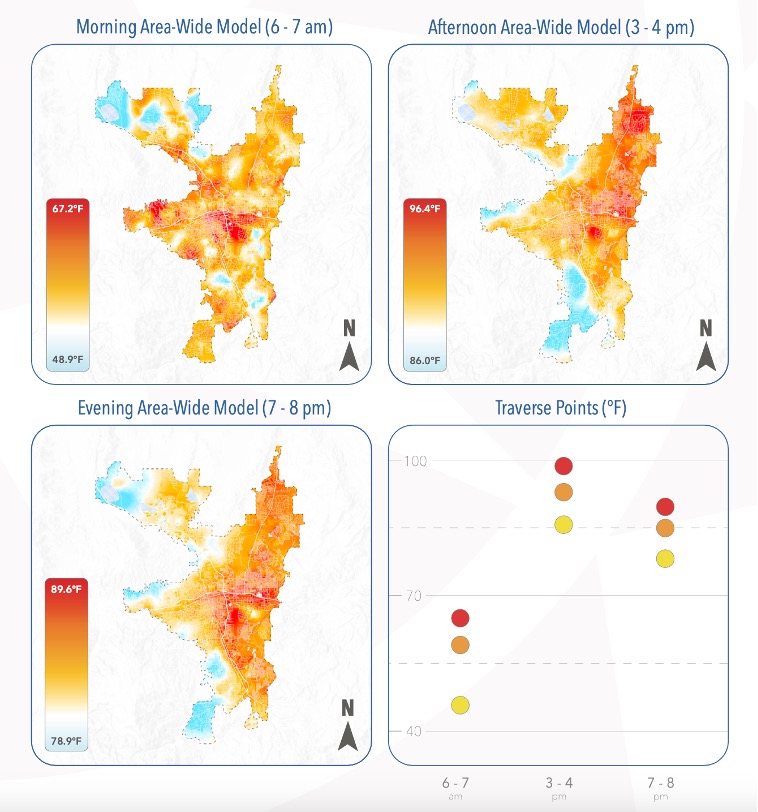
The campaign took place on August 10th, a clear and hot day for our region. The measurements and maps produced from the campaign reveal a great deal of variability across the nearly 200 square miles of our study area and between the early morning, mid-afternoon, and early evening time periods of the study.
In the mid-afternoon 3-4PM window, the hottest time of day, parts of our community were more than 20°F warmer than others. While much of this range was linked to differences in elevation, vegetation and manmade surfaces also play a major role. During the early afternoon heat, the hottest places tended to be low elevation valley floor locations with extensive paved roads and parking lots, and fewer mature trees. In contrast, the coolest areas (such as in neighborhoods along the Mt Rose Highway) tended to have higher elevations and more tree canopy.
Maps from the summary report showing regional temperature gradients across the day.
The mapping effort also showed how some areas hold onto heat more than others. The industrialized core areas of Reno-Sparks adjacent to I-80 and I-580 remained among the warmest in the community into the evening and even into the early morning hours. In contrast, valley bottom areas farther away from this core cooled down substantially, with some being cooler in the early morning hours than nearby neighborhoods perched on the Sierra slope. Scientists anticipate that these three snapshots of warm-hot temperature patterns are representative of conditions observed on other similarly hot summer days.
These results indicate that people living, working, or learning in different areas of our community may have vastly different exposure to high temperatures. While some areas may have safe temperatures for outdoor activity, other areas may place people at risk for heat-related illness. It may be easy to understand how the hottest afternoon temperatures can be dangerous, but the importance of evening, nighttime, and early morning temperatures should not be overlooked. Comfortable sleeping temperatures are critical to allow people to physiologically recover from daytime heat exposure. At all times of day, there is a great deal of variability in temperatures across our region.
Knowing which areas are subjected to higher temperatures may help our community more precisely target mitigation efforts. Effective efforts include the use of heat-reflective surfaces and water-smart tree planting, employing heat-informed architectural designs, and the use of health advisories to keep community members informed during periods of extreme heat.
“The information collected through this effort will be indispensable for our urban heat modeling research,” says John Mejia, Associate Research Professor of climatology at DRI. “By creating a digital twin of the Reno-Sparks region, we can simulate various heat mitigation strategies to evaluate their cooling effects and identify the most effective solutions for the city. This approach also enables us to analyze the uneven distribution of heat impacts across the area, highlighting how hotter zones face greater challenges such as increased air conditioning costs, infrastructure wear, and heightened water demand.”
The release of these results is just the beginning. The project team is planning a Heat Summit for May 2025 to bring scientists, city agencies, and community members together to discuss the results. More information will be released in the coming months. The data will also be analyzed in scientific studies, used for prioritization and decision making, and act as a baseline as the community works to reduce our exposure to dangerously high temperatures. As temperatures continue to rise in our state and in our world, it will be important to minimize additional heating from local factors that we have more ability to control. And knowing that hot weather is always going to be a part of our climate, being aware of the dangers and being prepared to respond is essential for keeping us all comfortable and protecting the most vulnerable members of our community.
“These heat data are incredibly helpful for Washoe County as we work to find solutions for the region’s increasing heat,” says Brian Beffort, Washoe County Sustainability Manager. “As we think about strategies to address heat and other impacts from our changing climate – such as tree planting and building weatherization – having accurate data at the neighborhood levels very much helps us direct these interventions to places where they will have maximum benefit.”
This project is part of the National Oceanic and Atmospheric Administration’s (NOAA) Heat Island Mapping Campaign and was completed with support from NOAA and their partners at CAPA Strategies. To access all the data collected from heat mapping campaigns across the country and the world, visit HEAT.gov.
The Reno-Sparks Heat Mapping Project was made possible through the participation and support from a broad community coalition, including scientists from the Nevada State Climate Office at the University of Nevada, Reno, The Desert Research Institute (DRI), The City of Reno, The City of Sparks, Washoe County, the Reno-Sparks Indian Colony, RTC-Washoe, the Reno-Sparks Chapter of Citizens’ Climate Lobby, Faith in Action Nevada, Make the Road Nevada, Northern Nevada Public Health, and the Truckee Meadows Regional Planning Agency.
###
About the University of Nevada, Reno
The University of Nevada, Reno is a public research university that is committed to the promise of a future powered by knowledge. Nevada’s land-grant university founded in 1874, the University serves 21,000 students. The University is a comprehensive, doctoral university, classified as an R1 institution with very high research activity by the Carnegie Classification of Institutions of Higher Education. Additionally, it has attained the prestigious “Carnegie Engaged” classification, reflecting its student and institutional impact on civic engagement and service, fostered by extensive community and statewide collaborations. More than $800 million in advanced labs, residence halls and facilities has been invested on campus since 2009. It is home to the University of Nevada, Reno School of Medicine and Wolf Pack Athletics, maintains a statewide outreach mission and presence through programs such as the University of Nevada, Reno Extension, Nevada Bureau of Mines and Geology, Small Business Development Center, Nevada Seismological Laboratory, and is part of the Nevada System of Higher Education. Through a commitment to world-improving research, student success and outreach benefiting the communities and businesses of Nevada, the University has impact across the state and around the world. For more information, visit www.unr.edu.
About DRI
We are Nevada’s non-profit research institute, founded in 1959 to empower experts to focus on science that matters. We work with communities across the state –and the world– to address their most pressing scientific questions. We’re proud that our scientists continuously produce solutions that better human and environmental health.
Scientists at DRI are encouraged to follow their research interests across the traditional boundaries of scientific fields, collaborating across DRI and with scientists worldwide. All faculty support their own research through grants, bringing in nearly $5 to the Nevada economy for every $1 of state funds received. With more than 600 scientists, engineers, students, and staff across our Reno and Las Vegas campuses, we conducted more than $52 million in sponsored research focused on improving peoples’ lives in 2024 alone.
At DRI, science isn’t merely academic – it’s the key to future-proofing our communities and building a better world. For more information, please visit www.dri.edu.
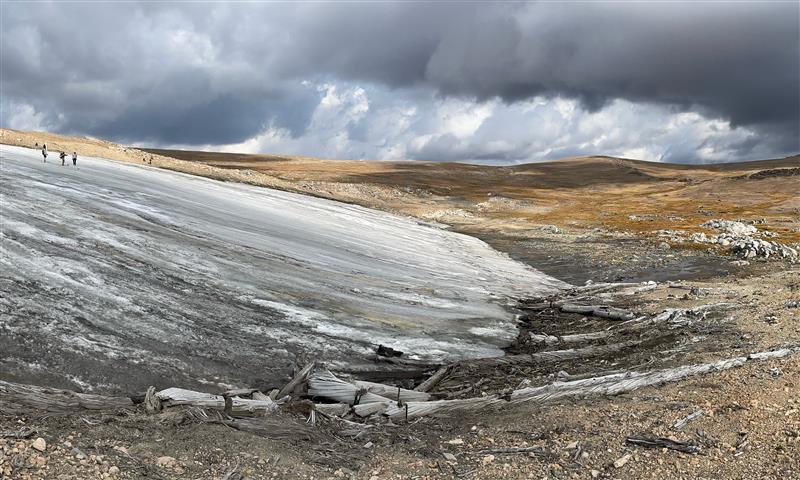
Reno, Nev. (January 15, 2025) – DRI scientists Joe McConnell and Nathan Chellman co-authored a new study that examines a 6,000-year-old forest preserved in a Rocky Mountain ice patch. The research, which was led by the USGS and Montana State University, used the fossil wood to develop tree-ring based temperature estimates of the mid-Holocene period. Their results show that long-term variations in Earth’s orbit and short-term increases in volcanic sulfur emissions resulted in global atmospheric cooling at the end of the mid Holocene warm period, causing Rocky Mountain forests to recede from higher elevations. The study can provide insight into the future elevational movement of forests under climate change, the scientists say.
McConnell and Chellman have conducted additional research on the Beartooth Plateau ice patch through ice core analysis and radar studies. “We’ve been trying to determine how the ice patch formed and why it has persisted and so preserved the buried forest for millennia,” McConnell says. That research will be shared in future publications.
BOZEMAN – Montana State University scientists say the frozen remnants of an ancient forest discovered 600 feet above the modern tree line on the Beartooth Plateau may portend possible changes for the alpine ecosystem if the climate continues to warm.
A paper about the discovery was published Dec. 30 in the journal Proceedings of the National Academy of Sciences. It describes what scientists have learned by studying the remains of a mature whitebark pine forest that formed at 10,000 feet elevation about 6,000 years ago, when warm-season temperatures in the Greater Yellowstone Ecosystem were similar to those of the mid-to-late 20th century.
The forest thrived for centuries until the climate began to cool about 5,500 years ago due to declines in summer solar radiation, the researchers found. The cooler temperatures shifted the tree line downslope and transformed the high mountain landscape from forest to the alpine tundra that exists today.
One of the paper’s authors, David McWethy, associate professor in the Department of Earth Sciences in MSU’s College of Letters and Science, said subsequent volcanic activity in the Northern Hemisphere caused the region’s already cooling temperatures to plunge. The pine forest was encased quickly in ice, where it remained preserved until the ice patch began to thaw in recent years. McWethy said its discovery yielded the first evidence from an alpine area of the ecosystem to indicate that mature forests had established upslope when temperatures were warmer.
“This is pretty dramatic evidence of ecosystem change due to temperature warming,” he said. “It’s an amazing story of how dynamic these systems are.”
The paper states that ice patches, unlike glaciers, do not flow. And until recently, the authors wrote, the ice patches slowly and near-continuously accumulated ice, “allowing preservation of deposited materials such as pollen, charcoal and macrofossils within their frozen layers.”
McWethy said the idea to explore Beartooth ice patches for at least 10,000 years of clues about past climate and environmental conditions grew out of work by Craig Lee, now an assistant professor in MSU’s Department of Sociology and Anthropology. In 2007, Lee recovered a portion of a 10,300-year-old atlatl from an ice patch on the plateau, alerting scientists that several millennia worth of cultural materials and environmental data was preserved in nearby layers of ice.
“Most of our best long-term climate records come from Greenland and Antarctica. It’s not a small thing to find ice patches that persisted for that long of a time period at lower latitudes in the interior continent,” McWethy said. The ice patches on the plateau measure hundreds of square meters size, which is fairly small compared to persistent ice masses elsewhere.
In 2016, Lee, McWethy and Greg Pederson, paleoclimatologist for the U.S. Geological Survey’s Northern Rocky Mountain Science Center and lead author of the just-published paper, were awarded a $100,000 Camp Monaco Prize to gather information about environmental change and past human activity from ice patches on the plateau. In 2018, they and others were awarded a grant from the National Science Foundation to study additional alpine ice patches in the area to reconstruct the ecosystem’s long-term climate history and its influence on Indigenous North Americans. McWethy said the NSF-funded work has involved a broad collaboration between tribes, federal agencies, archaeologists and scientists at several universities. The tree line study covers one aspect of the work.
The scientists say it was necessary to study multiple elements of the ancient ecosystem to piece together the frozen forest’s complete story. Members of the team, including MSU graduate and undergraduate students, analyzed layers of water isotopes and organic materials in ice cores taken from the patch, and Pederson harvested cross-sections of wood from the ancient trees for radiocarbon dating. Pederson said the work proved that tree line on the plateau shifted upward in response to regional warming and that the pine forest thrived for 500 years while climate conditions remained moderate and moist.
“The plateau seems to have been the perfect place to allow for ice patches to establish and persist for thousands of years, recording important information on past climate, human activity and environmental change,” Pederson said.
The results of the study suggest current climate conditions could lead to trees moving upslope into areas of the plateau that are now tundra. Pederson stressed, however, that even though the results of the study are site specific, there are strong connections to climate controls on tree line elevations globally.
“Growing season temperatures are the primary control on tree line elevation and latitude,” Pederson said. “However, at individual tree line locations, other factors such as moisture, wind, snowpack and human disturbance may play an important role in dictating forest structure and elevational limits.”
For those reasons, it’s impossible to predict exactly what future tree line forests on the Beartooth Plateau will look like in terms of density, distribution or tree species composition, which will vary depending on how much warming occurs, according to McWethy and Pederson. The tree line will likely rise as the climate warms, they say, but precipitation levels will determine the structure and extent of new forest.
Changes will have significant implications for the future ecosystem, say the study authors, including climate expert and MSU Regents Professor Emerita Cathy Whitlock, who has worked in the Greater Yellowstone Ecosystem for 40 years. She and Pederson said less high-elevation snowpack would affect downstream water supplies for irrigation and electricity generation. McWethy added that if forests begin to establish in tundra, fuel conditions could change dramatically, potentially increasing the risk of wildfires.
“That’s the reason why studies of past ecological change are more than interesting pieces of science,” Pederson said. “They have much larger implications for the resources we all depend on.”
David McWethy, associate professor, Department of Earth Sciences, at dmcwethy@montana.edu
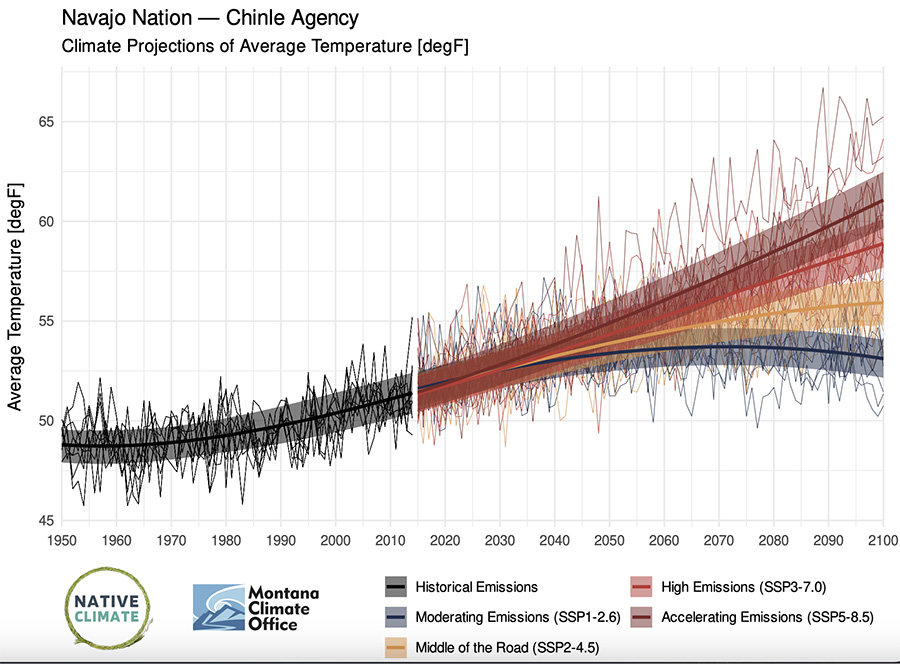
Detailed future projections for 633 tribal areas focus on agricultural climate variables
By Kelsey Fitzgerald, Native Climate
Earth’s climate future is often discussed in terms of degrees of warming, but for farmers and ranchers, temperature is not the only metric that matters. Other variables such as the number of frost-free days, timing of first snowfall, or changes in spring and summer precipitation are critical to planning future planting, growing, irrigating, and harvesting activities.
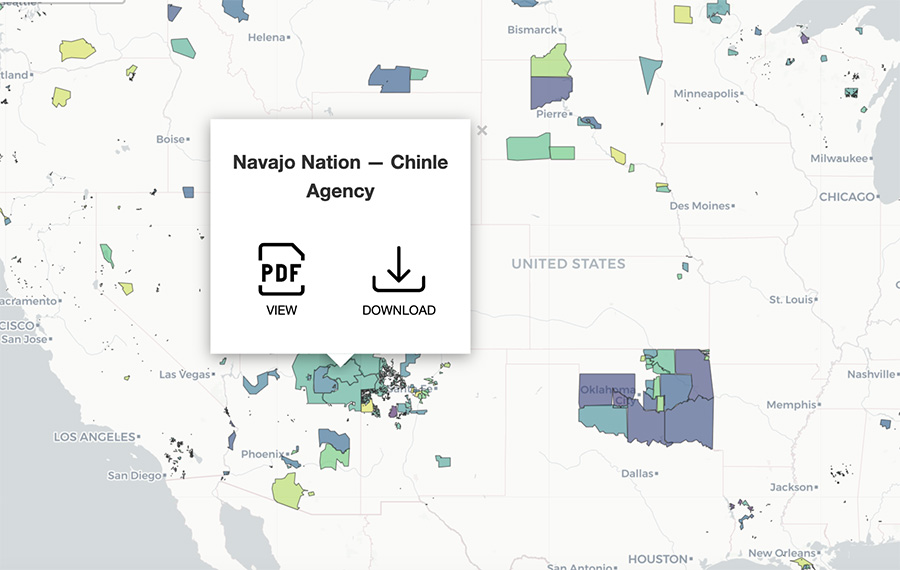
To help Native agricultural producers prepare for the changes to come, Native Climate (https://native-climate.com/) has compiled detailed local climate projections for 633 tribally controlled areas in the United States, including Alaska Native Villages and State Designated Tribal Areas, and climate divisions for the State of Hawai‘i.
The projections extend through the year 2100 and include twenty-six agricultural climate variables such as temperature, wind speed, growing season length, and precipitation by season. These climate variables were identified through conversations between Native Climate team members and tribal agricultural producers over the course of several years.
“Our tribal partners asked us specific questions in regard to the challenges they are dealing with in agriculture, or how to deal with new information like the impact of heat on human health,” explained Native Climate Program Director Maureen McCarthy, research professor of environmental science at Desert Research Institute. “The new set of projections were created in response to those questions, to provide detailed information about key things that our partners wanted to know more about.”
The climate projections were developed by Kyle Bocinsky, Director of Climate Extension for the Montana Climate Office, using data based on the NASA Earth Exchange (NEX) Global Daily Downscaled Projections (GDDP) dataset (NEX-GDDP-CMIP6). The projections include historical data from 1950-present and future conditions under four emissions scenarios and are presented in the form of easy-to-read graphs that can be downloaded from the Native Climate website as PDF files.
“One thing we’ve heard over and over from communities is that they want these data in a format they can drop right into Tribal climate adaption and hazard mitigation plans,” Bocinsky said. “We’ve really worked to provide straightforward access.”
Bocinsky and McCarthy have been sharing the projections with Native communities at workshops and conferences, including the 2024 Extension Risk Management Education (ERME) conference, the National Tribal and Indigenous Climate Conference (NTICC), and the First American Land-Grant Consortium (FALCON) conference. The projections are an evolving resource, McCarthy added; if anyone has a specific climate-related question they would like answered for their region, they can contact Bocinsky and he can model the climate variable they are interested in.
“When we presented in Alaska, for example, the tribes there saw that our projections included ‘number of days over 100oF’ to indicate future heatwaves,” McCarthy said. “They told us that they’re seeing health impacts in their communities if it’s over 70oF. Now we’re doing projections for the Alaska tribes on the number of days over 70oF, so that that gives you an idea of how this is an evolving dataset.”
The Native Climate team encourages use of these projections for many purposes, including climate communication. Participants in Native Climate’s Reporter Program have been incorporating the projections into stories that document climate impacts in their local communities. Other students from tribal colleges and universities have used these projections as a jumping-off point for artwork, children’s books, video projects, card games, and more through the All Climate is Local Project.
The climate projections can be accessed and downloaded via an interactive map on the Native Climate website: https://native-climate.com/projections/. For more information or to request a specific climate variable to be modeled for your region, please contact Kyle Bocinsky, kyle.bocinsky@umontana.edu.
###
Native Climate (https://native-climate.com/) supports climate adaptation efforts in Native American communities of the Southwest and Northern Plains regions by building new connections between Native wisdom and western scientific data. Through two-way information-sharing and relationship-building, Native Climate aims to make climate data more accessible and useful to Tribes in Northern Plains and Southwest Climate Hub regions, and to build awareness nationally about climate impacts and resilience on Native lands. The project is led by the Desert Research Institute in partnership with the Federally Recognized Tribes Extension Program (FRTEP), University of Nevada, Reno Tribal Extension, University of Montana, Montana State University, University of Arizona Extension, and the USDA Climate Hubs. Native Climate is funded by the U.S. Department of Agriculture and builds on the work of the Native Waters on Arid Lands project (2015-2022).
A projection showing average annual temperature from 1950-2100 for the Navajo Nation’s Chinle Agency. Credit: Native Climate. Climate projections for 633 Tribally controlled regions are now available on the Native Climate website via a clickable interactive map. Credit: Native Climate.
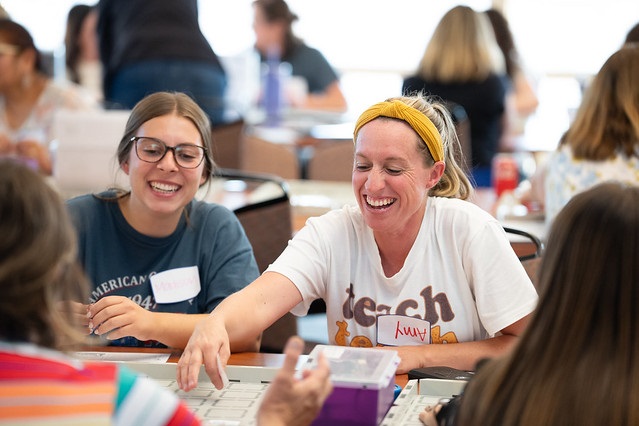
The Nell J. Redfield Foundation recently made a three-year commitment to support Nevada Robotics’ Books and Bots Teacher Trainings which will provide classroom lessons in Pre-Kindergarten through fifth grade classrooms using robots and storybooks.
Thanks to the Redfield Foundation’s generous support, Nevada Robotics will host ten trainings over the next three years for eight Redfield Community Outreach Program (RCOP) elementary schools in Northern Nevada, with the goal of reaching students, educators, and families that have not previously received this training. Educator stipends and on-going classroom support will be provided, as well as the necessary robots, books, and other training materials.
These trainings will have significant long term positive benefits for Northern Nevada educators and students. Through the estimated 40 educators reached at the end of the third year, roughly 1,280 students will benefit from these lessons year after year. Further, recent studies have identified a positive link between early STEM education and language & literacy skills. Overall, Nevada Robotics seeks to increase equity and access to computer science and STEM skills for Nevada students, thereby better preparing them for a technology driven world.
Thank you to the Nell J. Redfield Foundation for helping DRI’s Nevada Robotics to create a better future for the people of Nevada and the world.
If you are interested in supporting DRI’s Nevada Robotics, click here.
This generous gift was made to DRI and Nevada Robotics in memory of Gerald “Jerry” Smith and his dedicated work to the Nell J. Redfield Foundation’s mission.
DRI’s Anne Heggli is partnering with the National Weather Service to understand flood risk from rain-on-snow storms in real-time, protecting communities and enabling water conservation throughout Nevada and California
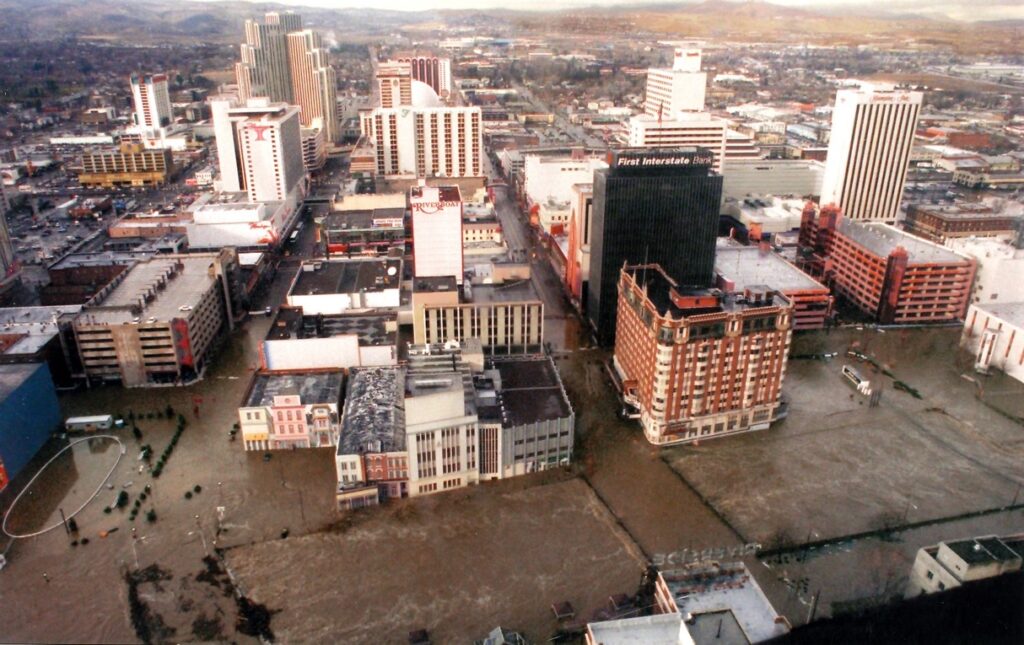
At the dawn of the new year in 1997, the Truckee River transformed. The winter season had thus far been great for snow, but when a subtropical storm from near the Hawaiian Islands rolled in, it carried with it unseasonably warm rain. The warm rainfall combined with snowmelt to swell the rivers, with the Truckee burying much of downtown Reno under water. Two people were killed amidst the nearly $1 billion disaster, and it wasn’t the first nor the last time that warm rains triggered severe flooding in the area.
These types of storms, called “rain-on-snow” storms, can produce river flows 50-80% higher than typical spring snowmelt. Nevada cities nestled against the dramatic peaks of the Sierra Nevada mountains are at particularly high risk from these storms: Reno and Carson City have records of flooding linked to these storms as early as 1862 and as recent as 2017. Despite the repeated challenge, predicting when these storms will occur and the risk of flooding remains challenging for scientists. DRI’s Anne Heggli, Ph.D., is on a mission to change that.
Heggli’s focus on rain-on-snow began early in her Ph.D. studies after she was approached by a water manager who told her that when it came to these warm storms, they felt like they were flying blind. “They had no idea how the snowpack was going to respond,” Heggli said.
Understanding how to predict when flooding will or won’t occur isn’t just important for public safety, but for water conservation as well. This is because water managers will remove water from reservoirs when flooding is expected, releasing it downstream to make room for the incoming flows. When water managers expect a flood that never arrives, the released water isn’t replenished, leaving less available for communities to draw from in the long dry season ahead. This is especially problematic for Nevada, the driest state in the nation.
With all this in mind, Heggli had the focus of her doctoral dissertation: to identify the weather and snowpack conditions that lead to flooding during rain-on-snow storms.
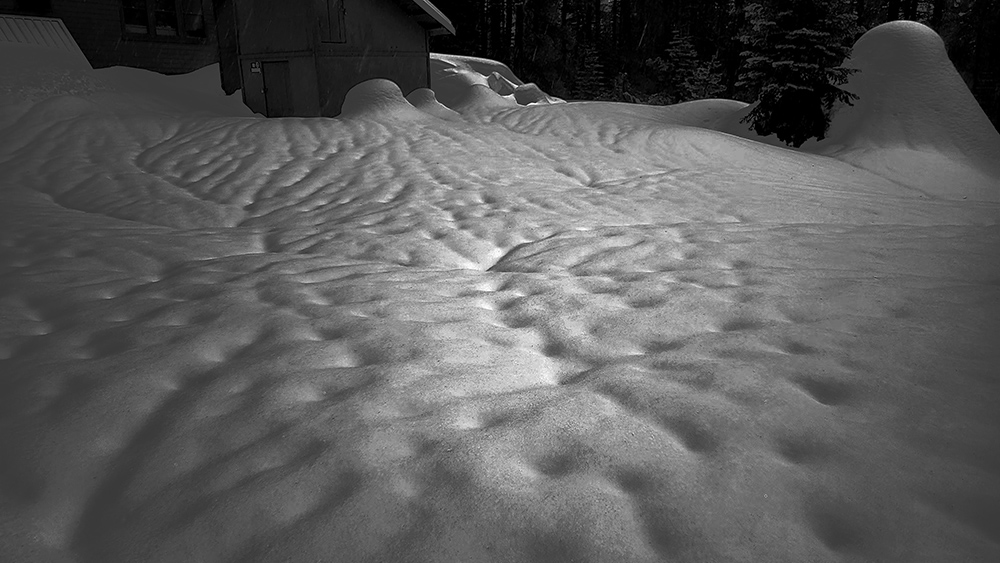
Flooded downtown Reno in January 1997 after a severe rain-on-snow storm.
Advancing Scientific Understanding of Rain-on-Snow Storms
Heggli’s idea centered on using the existing Snow Telemetry (SNOTEL) Network to monitor real-time conditions in the mountains. This network has more than 800 automated weather stations scattered throughout high-elevation mountains in the Western U.S. Each station monitors the snowpack, precipitation, temperature, and soil conditions in order to help forecast water supply, as mountain snowpacks serve as some of the most critical water reservoirs in this part of the world.
Each of these stations, Heggli thought, had untapped potential. The measurements taken were being used on a daily timescale, but they were actually collecting hourly data, and it was this information that could help forecast potential floods.
“We really use the daily data, but the hourly data has not been applied,” Heggli said. “And I felt like there was a great opportunity to analyze it to shave away at some of the uncertainty about how the snowpack responds to rain and help inform the people who are managing our water in the Sierra Nevada.”
The SNOTEL stations in the Sierra Nevada mountains have included soil moisture sensors since 2006, which Heggli believed could provide insight into how the snowpack is contributing to runoff.
“When a rain-on-snow event occurs and the rainfall makes its way through the snowpack, there are these really prominent signals in the soil moisture data, so it’s a way to actually verify if the snowpack is releasing rainwater or snowmelt,” she says.
“The soil moisture data is key for my research because I can identify when the snowpack is releasing water, and then look at the snow density, air temperature, and precipitation,” she continued. “That way I can identify the patterns that are present every time the soil moisture has these really dramatic responses to find the ingredients that produce more impactful runoff rain-on-snow events.”
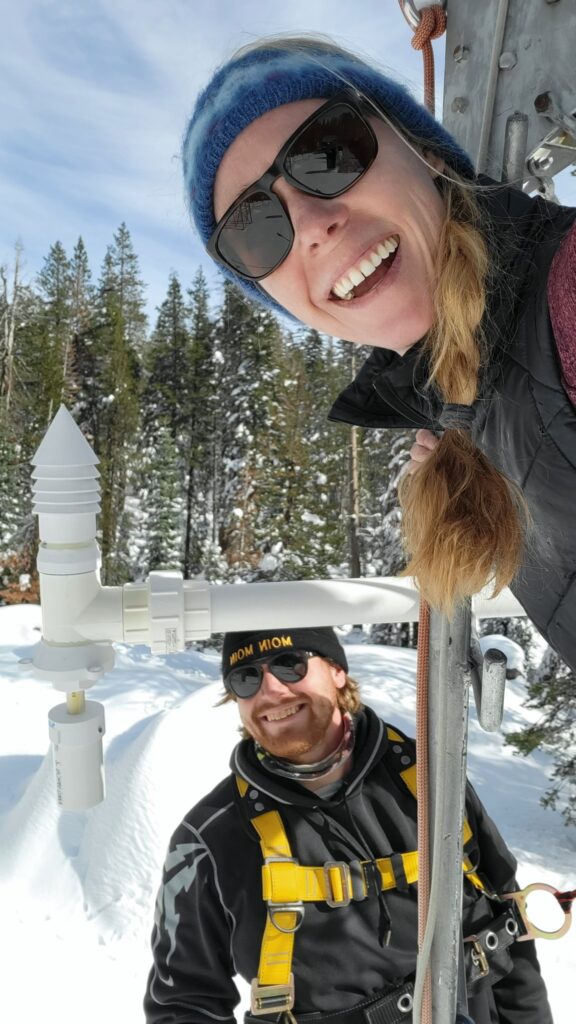
Anne and colleague Bjoern Bingham at the Cental Sierra Snow Lab’s SNOTEL weather station.
Anne’s work is helping fill gaps in what scientists know about rain-on-snow storms, such as where the soil moisture is coming from: rainfall, melting snow, or some combination of the two?
“It’s really about trying to tease out whether the runoff during rain-on-snow events comes from melting snow, or is it just rainfall and increased runoff efficiency?” she says. “What exactly is producing the runoff and why is it so hazardous? What are the ingredients of a perfect storm for those major rain-on-snow flood events?”
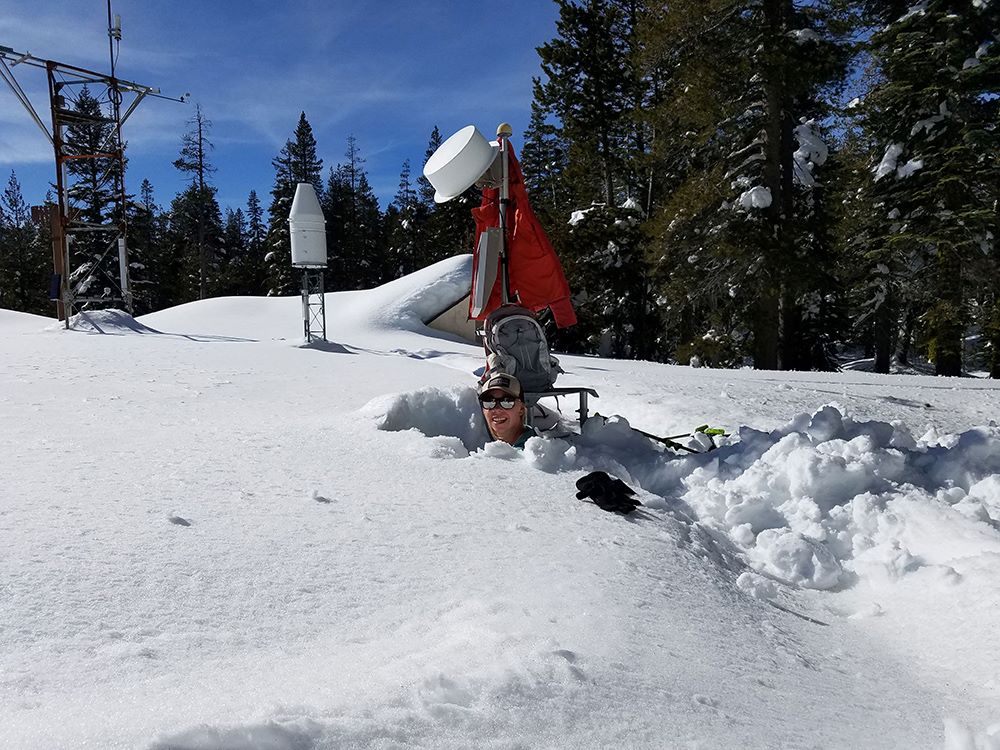
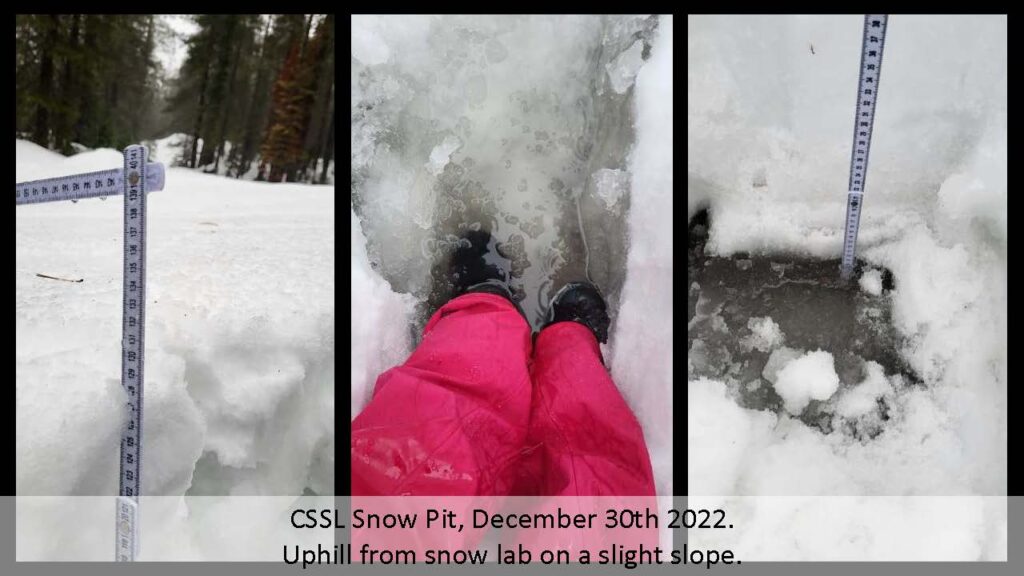
To help answer these questions, Heggli would head to the Central Sierra Snow Lab during storms. Here, she could dig snow pits that allowed her to see how water was flowing through the snowpack. During one visit, she measured 9cm of water at the base that grew to 13cm by the time she was leaving.
“It just really shows that the water is not able to move through the soil anymore and enter the streams that way — it’s now making its way over the surface,” she says. “And that is something that can really cause a lot of flooding, because it just moves so much quicker.”
“Anne’s work investigating rain-on-snow events is an exciting application of SNOTEL data,” said Jeff Anderson, Nevada Water Supply Specialist with the Natural Resources Conservation Service (NRCS). “The SNOTEL weather station network exists so the NRCS can forecast seasonal runoff in the western United States. To accomplish this goal, the NRCS relies on quality-checked daily data from the SNOTEL network.”
“Rain-on-snow events have produced our region’s most impactful floods,” he continued. “Anne methodically quality checks and integrates hourly SNOTEL data from a variety of sensors to predict when conditions could result in flooding. This is an important operational advancement in flood prediction, and it is exciting to see how NRCS SNOTEL data can be applied in new ways to benefit the public.”
Anne Heggli inside a snowpit at the Central Sierra Snow Lab on Donner Pass.Heggli’s measured the amount of standing water at the base of the snowpack during a December 2022 storm.When rain falls on snow, it leaves patterns showing the flow of water through the snowpack, what hydrologists refer to as “preferential flow paths.”
Partnerships That Produce Actionable Science
Heggli’s work is notable not only for the scientific advancements, but also for how she has approached it. She partnered with the National Weather Service early on to ensure she was developing a useful tool for predicting rain-on-snow to help decision makers and emergency managers on the ground. With funding from UCAR through an educational partnership program called COMET that promotes university partnerships with NWS offices, she worked with hydrologist Tim Bardsley to co-develop a decision support tool that his own office would ultimately be using to monitor flood risk.
This initial funding was key, Heggli says, to establishing a productive working relationship that focused on producing research for the stakeholders.
“It was really this grant that allowed me to have that relationship with Tim to get the feedback that I needed to get this thing going in the right direction from the beginning,” Heggli says. “It’s been successful because it allowed me to build off the partnership with additional stakeholder partners like the Central Sierra Snow Lab and the Nevada Department of Transportation.”
Heggli emphasizes how unusual this type of grant funding can be, as most grants aren’t designed in a way that promotes close working relationships with stakeholders, allowing the research product to realign with stakeholder needs.
“Anne’s work has broadened our understanding of rain on snow, and just how rapidly rain can move through even deep and cold snowpacks to impact soil moisture, stream response and flood risk,” Bardsley says. “The tools Anne has developed help us at NWS Reno and the California Nevada River Forecast Center (CNRFC) quickly visualize near real-time data to highlight areas where rain is likely moving through the snowpack. This can help us better understand where and when our models are performing well, or not so well.”
The result is a tool that produces a map with a color-coded risk scale showing the potential for flooding in real time. For now, the tool is shared with Heggli’s partners at the NWS and NDOT so that they can make decisions about how to communicate flood risk to the public and water managers, and prepare emergency resources.
“They’re the ones that have to respond to flooding and help the communities out,” she says.
Heggli’s snowpack runoff decision support tool in action, demonstrating hourly runoff potential for a rain-on-snow flooding event that occurred on Dec. 31, 2005.
The map currently covers California and Nevada, but Heggli plans to expand it to include all of the SNOTEL stations across the Western U.S. She also has plans to make the tool publicly accessible and interactive through an online portal with DRI’s Western Regional Climate Center. A second COMET grant is helping develop the tool to integrate probabilistic forecast information to increase the lead time for flooding predictions.
“Right now, the tool is showing what’s happening on the mountain as it’s happening,” she says. “But if we can start to bring in probabilistic forecast information, we can see the spread of rainfall and air temperature at the different stations, and then start to communicate ‘Okay, we have an 80% chance that rain-on-snow runoff will happen at these lower elevations and a 20% chance at the mid elevations.’ It will help shave off uncertainty and forecast what might happen a few days out, which will help optimize water releases in reservoirs without increasing flood risk.”
Heggli emphasizes that this tool is the only real way that scientists can get information about flooding potential during storms, because satellite data doesn’t work with cloud cover and predictive models often omit outlier events — “but in the Sierra Nevada, those outliers are the events that impact us the most,” she says.
###
Note: Research featured in this article made possible through funding provided by:
University Corporation for Atmospheric Research COMET Outreach Program grant # MV1JFXA4S621 and Nevada Department of Transportation grant #P296-22-803
The free events focus on improving literacy in young students through engagement with hands-on activities about electricity and the natural world.
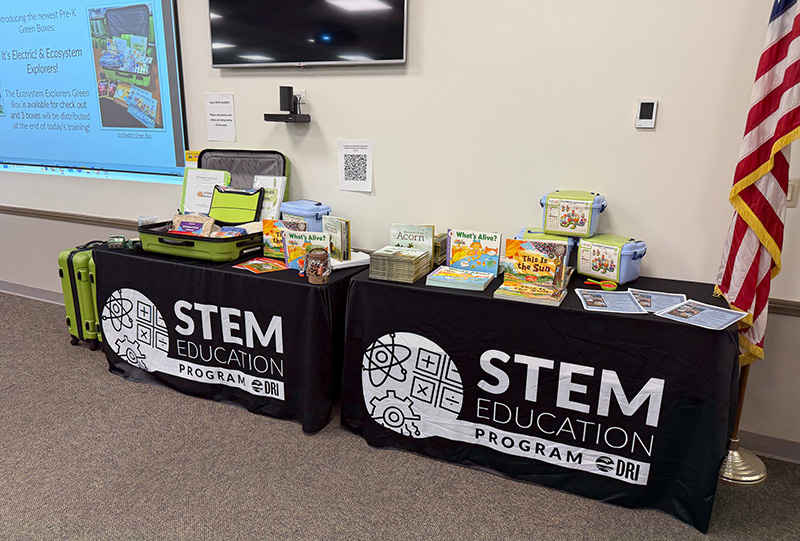
Reno, Nev. (March 3, 2025) – DRI’s STEM Education Program is holding free events focused on developing literacy through engaging science activities for Pre-K children 5 and younger throughout Nevada. Through hands-on experiments, story time, and interactive games, the events will bring ecology and electricity to life for the whole family. Each child will also receive free books to take home (while supplies last).
Events in Northern Nevada focus on electricity and will explore the fundamentals of lightning, investigate how circuits and switches work, and discover the many uses for electricity in our local communities. At Southern Nevada events students will learn about ecosystems, discover how living and nonliving things depend on one another, and explore the wonders of the natural world through play and observation.
“These events provide Nevada families with a way to engage young learners in a fun and interactive environment,” says Emily Mcdonald-Williams, Director of the STEM Education Program at DRI. “Our hope is that families start exposing kids to learning through play at a young age, which helps with early development and establishes a love of learning.”
Families are encouraged to stop by any time during the events, but can sign up to receive more information at the link for each event below.
Upcoming dates and locations:
Mesquite: 12:30-2:30pm on Saturday, March 15, 2025 at Mesquite Works STEAM Center Sign up link: https://tinyurl.com/MesquiteFamilyFun Activity Theme: Ecosystems
Reno: 3-6pm on Saturday, March 15, 2025 at the Reno Public Market Sign up link: https://tinyurl.com/renofamilyfun Activity Theme: Electricity
DRI’s STEM Education Team will also make the activities available to educators across Nevada as the Ecosystem Explorers and It’s Electric teaching kits—part of the broader Green Box program. These self-contained teaching kits filled with lesson plans are available to all formal and informal educators in Nevada and are delivered free of charge. The lessons contained in each box are designed with the help of DRI scientists and targeted to engage learners in specific grade levels, from Pre-K through 12th grade. There are currently 33 different Green Box topics available ranging from water conservation to astrobiology. To see the full list of available Green Boxes and reserve one for your classroom or homeschool group, visit the Reservation Link.
Funding acknowledgement: This program is funded by the Early Childhood Literacy Program through the Nevada Department of Education.
We are Nevada’s non-profit research institute, founded in 1959 to empower experts to focus on science that matters. We work with communities across the state — and the world — to address their most pressing scientific questions. We’re proud that our scientists continuously produce solutions that better human and environmental health. Scientists at DRI are encouraged to follow their research interests across the traditional boundaries of scientific fields, collaborating across DRI and with scientists worldwide. All faculty support their own research through grants, bringing in nearly $5 to the Nevada economy for every $1 of state funds received. With more than 600 scientists, engineers, students, and staff across our Reno and Las Vegas campuses, we conducted more than $52 million in sponsored research focused on improving peoples’ lives in 2024 alone. At DRI, science isn’t merely academic — it’s the key to future-proofing our communities and building a better world. For more information, please visit www.dri.edu.